

For high-income professionals, tax-advantaged retirement planning hits a ceiling quickly. Roth IRA contributions phase out at certain income levels. 401(k) limits are modest relative to earnings. For someone earning $400,000, $600,000, or more annually, conventional retirement accounts simply cannot absorb enough capital to build meaningful tax-free retirement income.
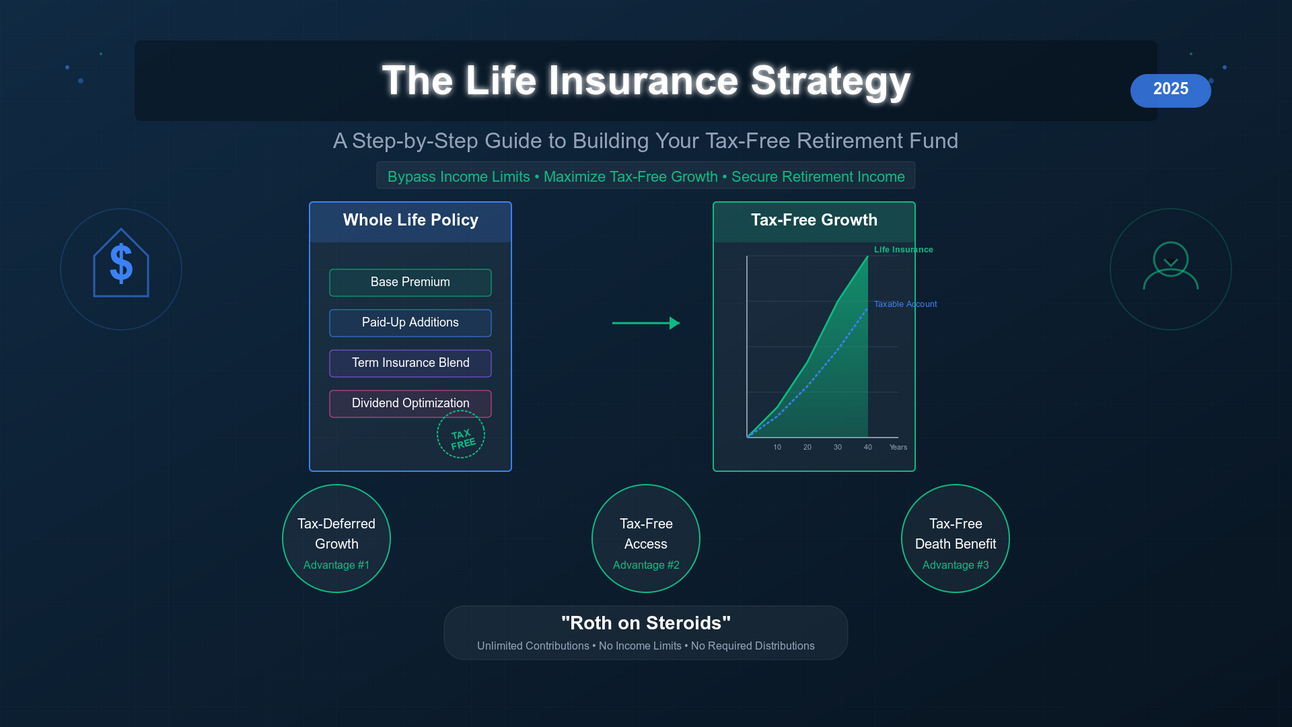
Specially designed permanent life insurance — specifically dividend-paying whole life from mutual carriers — offers a different path: tax-deferred accumulation, tax-free access through policy loans, and a tax-free death benefit. No income limits. No contribution caps set by the IRS. The structure earns its reputation as a complement to maxed-out retirement accounts precisely because it operates outside the boundaries of qualified plan rules.
This guide covers how the strategy works, how policies are designed to maximize cash accumulation rather than death benefit, premium optimization techniques, three case studies, and honest consideration of the drawbacks.
Section 1: The Tax Advantages — How the Structure Works
Properly designed permanent life insurance offers three distinct tax advantages:
| Advantage | How It Works |
|---|---|
| Tax-deferred accumulation | Cash value grows without annual income or capital gains taxes |
| Tax-free access | Policy loans and withdrawals up to basis do not create taxable income |
| Tax-free death benefit | Remaining value transfers to beneficiaries free of income tax |
Why This Fills a Gap Conventional Accounts Cannot
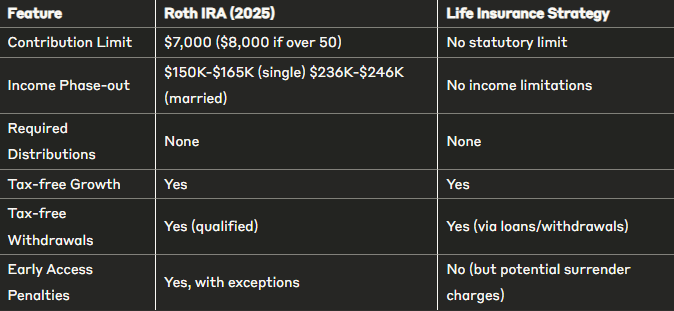
| Feature | Roth IRA | Traditional 401(k) | Whole Life (Properly Designed) |
|---|---|---|---|
| Income limits | Yes — phases out at higher incomes | No | No |
| Annual contribution cap | $7,000 | $23,500 | None (limited only by underwriting) |
| Tax on contributions | After-tax | Pre-tax | After-tax |
| Tax on growth | Tax-free | Deferred | Tax-deferred |
| Tax on distributions | Tax-free | Ordinary income | Tax-free via loans |
| Required minimum distributions | No | Yes (age 73) | No |
| Effect on Medicare premiums | No | Yes (increases MAGI) | No (policy loans not counted) |
| Death benefit | None | None | Tax-free to beneficiaries |
Policy Type for This Strategy
This guide focuses exclusively on dividend-paying whole life insurance from mutual insurance companies. These policies offer:
- Guaranteed cash value growth
- Non-guaranteed dividends (historically producing 5% to 6% total returns)
- Strong contractual guarantees
- A mutual ownership structure (owned by policyholders, not shareholders)
This is a distinct category from universal life, variable life, or indexed universal life products — each of which carries different guarantee structures, cost profiles, and risk characteristics. The whole life focus reflects the conservative, long-term nature of building a reliable retirement supplement.
Section 2: Policy Design — Building for Cash Accumulation
The distinguishing factor between a standard life insurance sale and this strategy is policy design. A policy optimized for cash accumulation looks fundamentally different from one sold primarily for death benefit protection.
The 4 Design Elements That Matter
1. Minimum Death Benefit Structure
For tax-advantaged cash accumulation, the policy is structured to carry the minimum death benefit required to maintain life insurance status under IRC Section 7702. This means:
- Structuring under the Guideline Premium Test (GPT)
- Selecting the lowest death benefit option (typically Option 1 or Level Death Benefit)
- Starting with the minimum death benefit required by the carrier’s underwriting guidelines
Lower death benefit = lower insurance costs = more premium dollars flowing into cash value.
2. Paid-Up Additions Rider (PUAR)
This rider is the engine of the strategy. It allows premium dollars beyond the base policy to be added immediately as paid-up insurance:
- Creates near-immediate cash value (typically 90 to 95 cents per dollar contributed)
- Carries minimal sales charges or commissions
- Allows year-to-year premium flexibility
A properly designed policy directs 60% to 90% of total premium into the PUAR rather than the base policy.
3. Term Insurance Blending
By replacing a portion of the permanent insurance requirement with a term rider, the policy:
- Reduces overall insurance costs
- Increases cash value efficiency in the early years
- Maintains the same total death benefit at lower cost
Most optimized policies use a 50% to 80% term insurance blend in the early years. As cash value grows, the term component gradually converts to permanent coverage.
4. Carrier Selection
| Criterion | What to Look For |
|---|---|
| Ownership structure | Mutual companies (policyholders own the company, not shareholders) |
| Dividend history | Consistent dividend payments, currently 5% to 6% range |
| Financial ratings | A.M. Best A++ or A+; Comdex score above 90 |
| Operating history | 100+ years of continuous operation |
| Policy loan rates | Low fixed or variable loan rates available |
| PUAR features | Flexible, high PUAR allowance |
Sample Optimized Structure
A 45-year-old male in excellent health with a $50,000 annual premium budget:
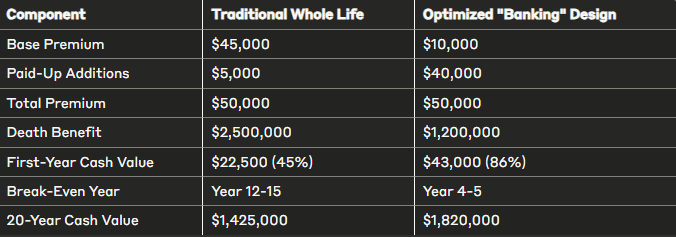
The restructuring concentrates premium dollars in the PUAR and term blend, dramatically increasing early cash value efficiency compared to a traditionally sold whole life policy.
Section 3: Premium Optimization Techniques
How you fund the policy matters as much as how it is designed.
1. The MEC Line Strategy
A Modified Endowment Contract (MEC) is a policy that exceeds federal funding limits (the “7-pay test”) and loses certain tax advantages — specifically, loans and withdrawals become subject to ordinary income tax and potential penalties prior to age 59½.
The goal is to fund as close to the MEC line as possible without crossing it:
- Calculate the policy’s 7-pay premium limit with your advisor each year
- Fund at 90% to 99% of this limit for maximum efficiency
- Adjust the death benefit in later years if needed to allow continued high-level funding
2. Strategic Front-Loading
Unlike strategies that benefit from dollar-cost averaging, whole life policies perform better with heavy early funding:
- Higher early premiums reduce the percentage of total costs relative to cash value over the policy’s life
- Earlier funding means more years of compound accumulation
- Front-loading accelerates past the breakeven point and reduces surrender risk
The “4-3-2-1” front-loading approach:

| Year | Relative Premium Level | Purpose |
|---|---|---|
| Year 1 | 4x base | Maximum early cash value; pushes quickly toward MEC line |
| Year 2 | 3x base | Continued heavy funding |
| Year 3 | 2x base | Transitioning to sustainable level |
| Year 4+ | 1x base | Ongoing sustainable premium |
This schedule is illustrative; actual ratios depend on the specific policy design and the individual’s 7-pay limit.
3. Premium Flexibility
One advantage of properly designed policies is the ability to adjust premiums without losing policy status:
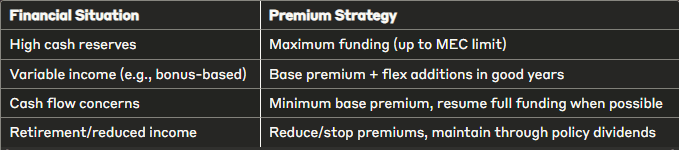
| Financial Situation | Appropriate Premium Response |
|---|---|
| Strong income year | Fund to MEC line maximum (PUAR allows additional premium) |
| Normal income year | Standard scheduled premium |
| Income disruption | Reduce or skip PUAR; maintain base premium to keep policy in force |
| Significant liquidity event | One-time PUAR addition within 7-pay limits |
Unlike qualified retirement plans, missing a premium does not trigger penalties or plan disqualification. The base policy remains in force as long as minimum premiums are maintained.
4. IRC Section 1035 Exchange
For those with existing cash value policies that are older or poorly designed, IRC Section 1035 allows a tax-free exchange into a new, more efficient policy:
- No taxable event on the transfer
- Existing basis carries over
- Enables a policy reset with better design, improved dividend rates, or updated features
Policies more than 10 years old are often good 1035 exchange candidates, particularly if they were sold primarily for death benefit with minimal PUAR optimization.
Section 4: Three Scenarios
Scenario 1: Dr. Mitchell — Medical Specialist
Profile:
| Item | Detail |
|---|---|
| Age | 42 |
| Specialty | Orthopedic surgeon |
| Annual income | $780,000 |
| Existing retirement accounts | 401(k) and backdoor Roth IRA already maximized |
| Primary goal | Tax diversification; hedge against future rate increases |
Policy design:
| Component | Detail |
|---|---|
| Annual premium | $100,000 |
| PUAR / base split | 80% / 20% |
| Term insurance blend | 65% |
Projected results:
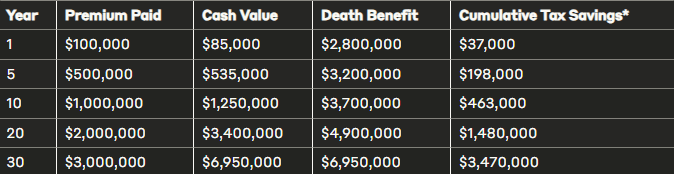
Retirement income strategy: Beginning at age 65, Dr. Mitchell can access approximately $250,000 annually through policy loans without creating taxable income, affecting Medicare premiums, or triggering Social Security taxation. This income stream can continue for 25+ years while maintaining a significant tax-free death benefit.
Comparison to taxable account: The same $100,000 invested annually in a taxable brokerage account with identical gross returns would produce approximately $185,000 annually in after-tax retirement income — a $65,000 annual reduction in spending power.
Scenario 2: Jennifer — Tech Executive with Equity Compensation
Profile:
| Item | Detail |
|---|---|
| Age | 38 |
| Role | VP, technology company |
| Compensation | $425,000 base + variable equity |
| Primary concern | Concentrated company stock; tax diversification |
| Secondary goal | Liquid assets outside employer’s control |
Policy design:
| Component | Detail |
|---|---|
| Base annual premium | $50,000 |
| Additional variable funding | From equity compensation events |
| PUAR / base split | 90% / 10% |
Projected results with variable funding:
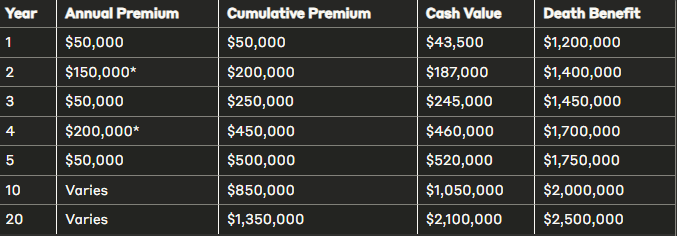
Strategic advantages:
- Diversifies away from concentrated equity position
- Builds liquid cash value outside company performance risk
- Creates tax-free retirement income that does not depend on future company stock value
- Policy loans do not affect MAGI, preserving favorable tax treatment in high-equity-event years
Scenario 3: Michael and Susan — Small Business Owners
Profile:
| Item | Detail |
|---|---|
| Ages | Michael 53, Susan 51 |
| Combined income | $950,000 |
| Primary goals | Tax advantages, business succession options, liquidity for opportunities |
Policy design:
| Component | Detail |
|---|---|
| Total annual premium | $200,000 |
| Structure | Two separate policies (one per spouse) |
| Michael’s policy | Corporate-owned for business planning applications |
| Susan’s policy | Personal for family and legacy planning |
Projected results at age 65:
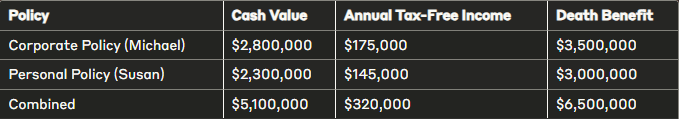
Business applications for the corporate-owned policy:
- Business continuation funding
- Executive benefit programs
- Key person protection
- Supplement to qualified retirement plans
Section 5: Tax Efficiency Comparison
Accumulation Phase — $50,000 Annual Premium Over 20 Years
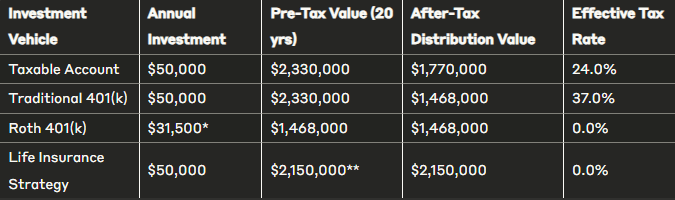
| Vehicle | After-Tax Value at Year 20 | Notes |
|---|---|---|
| Whole life (properly designed) | See illustration | Lower gross value reflects internal costs; superior after-tax result due to tax-free access |
| Roth IRA | Limited by $7,000/year cap | Excellent tax efficiency but contribution cap severely limits accumulation for high earners |
| Traditional 401(k) | Distributions fully taxable | Pre-tax accumulation; distributions taxed as ordinary income |
| Taxable brokerage | Subject to annual taxation | Dividends and gains taxed annually; capital gains on sale |
Distribution Phase — Annual After-Tax Retirement Income
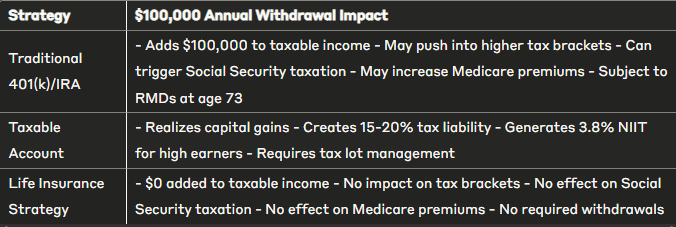
Policy loans from a whole life policy are not taxable income. They do not increase MAGI, do not trigger IRMAA Medicare surcharges, and do not cause Social Security benefits to become taxable. A $200,000 annual policy loan produces the same after-tax spendable income as a $200,000 taxable account withdrawal would produce after taxes — with the tax bill eliminated entirely.
Section 6: Implementation Timeline
Phase 1: Foundation Years (Years 1 to 5)
The early years carry the most visible insurance costs. Expect:
| Year | Cash Value to Premium Ratio | Key Milestone |
|---|---|---|
| Year 1 | 80% to 90% (vs. 0% to 65% in traditionally designed policies) | PUAR creates near-immediate cash value |
| Years 2 to 3 | Improving each year | Building momentum past initial costs |
| Years 4 to 5 | Approaching or reaching breakeven | Cash value equals or approaches total premiums paid |
Phase 2: Growth Phase (Years 6 to 15)
| Marker | What Happens |
|---|---|
| Dividends accelerating | Larger cash value base produces larger dividend credits each year |
| Term converting | Term insurance components begin converting to permanent coverage |
| Cost ratio improving | Internal costs as a percentage of cash value decline steadily |
| Cash value growing faster | Annual growth begins exceeding annual premium contributions |
This phase is the optimal window to begin small policy loans if needed, with attention to loan management to keep the policy in force.
Phase 3: Maturity Phase (Years 16+)
- Cash value growth substantially exceeds premium payments
- Death benefit continues increasing through dividend additions
- Premium flexibility increases — many policyholders reduce or stop premiums at this stage
- Systematic retirement income distributions can begin efficiently
Retirement Access Strategy
| Step | Action | Tax Treatment |
|---|---|---|
| 1 | Withdraw up to total basis (premiums paid) | Tax-free — already after-tax dollars |
| 2 | Switch to policy loans for income above basis | Tax-free — loans are not income |
| 3 | Select loan type | Fixed vs. variable rate based on rate environment |
| 4 | Sustainable withdrawal rate | 4% to 5% of cash value annually (policy-design dependent) |
| 5 | Monitor death benefit | Ensure policy remains in force through projected life expectancy |
Critical: Outstanding loan balances accrue interest. If loans are not serviced and the cash value is depleted, the policy lapses — and any outstanding loan balance above basis becomes taxable income. Proper loan management is essential.
Section 7: Drawbacks and Honest Considerations
1. Internal Costs Create Drag
Despite optimized design, insurance costs reduce net returns compared to a pure accumulation vehicle. This is the price of the tax structure. The strategy only makes sense when:
- The tax benefits outweigh the internal costs
- The holding period is long enough (typically 15+ years minimum) for the tax advantages to dominate
- The policyholder is in a high enough tax bracket to meaningfully benefit from tax-free access
At lower income levels or shorter time horizons, simpler alternatives typically produce better outcomes.
2. Ongoing Management Is Required
These policies are not passive. Annual decisions include:
- Dividend option selection (paid-up additions, reduce premium, accumulate at interest, or cash)
- Loan interest payment or capitalization decisions
- Premium adjustment relative to MEC limits and financial circumstances
- Death benefit adjustments as circumstances change
Working with an advisor who specializes in ongoing policy management — not just initial sales — is essential.
3. Carrier Financial Strength Is Non-Negotiable
The entire strategy depends on the insurance company remaining solvent and continuing to pay dividends over a 20 to 40+ year horizon.
| Criterion | Minimum Standard |
|---|---|
| A.M. Best rating | A+ or A++ |
| Comdex score | 90 or above |
| Operating history | 100+ years |
| Ownership structure | Mutual preferred |
State guaranty funds provide a safety net if a carrier fails, but limits vary by state and are far below the balances that accumulate in long-running policies. Carrier selection is a decision that deserves as much rigor as the policy design itself.
Section 8: Implementation Action Plan
| Step | Action | Key Consideration |
|---|---|---|
| 1. Qualification assessment | Confirm 5+ year premium commitment; verify conventional accounts are maximized first; confirm adequate liquid reserves | This strategy complements — it does not replace — conventional retirement accounts |
| 2. Advisor selection | Find an advisor who works with multiple carriers, specializes in cash accumulation design, and offers ongoing policy management | Avoid single-carrier captive agents; insist on side-by-side carrier comparisons |
| 3. Policy design | Review multiple carrier options; examine each component’s purpose; request stress-tested projections under lower dividend scenarios | Illustrations using current dividend rates are optimistic; review reduced dividend scenarios |
| 4. Application and underwriting | Submit application; complete medical exam if required; review final approved policy against design specifications | Confirm all design elements (PUAR ratio, term blend, death benefit option) match the agreed plan |
| 5. Ongoing management | Schedule annual policy reviews; track performance against projections; adjust premium strategy as income changes | Year 5 and Year 10 reviews are particularly important checkpoints |
Is This the Right Strategy?
| Situation | Fit |
|---|---|
| Income consistently above Roth IRA phase-out thresholds | Strong fit |
| Conventional accounts already maximized | Strong fit |
| 15+ year time horizon with premium commitment | Strong fit |
| High current marginal rate (32% or above) | Strong fit |
| Need for liquidity flexibility without tax consequences | Strong fit |
| Insurable in good health | Required — underwriting determines eligibility and cost |
| Time horizon under 10 years | Poor fit — insufficient time for tax benefits to outweigh costs |
| Income primarily below 24% bracket | Questionable — tax benefit less compelling at lower rates |
| Existing conventional accounts not yet maximized | Address those first |
This article is for informational and educational purposes only and should not be construed as personalized financial, tax, or legal advice. The scenarios and projections shown are hypothetical and for illustrative purposes only. Actual results will vary based on individual circumstances, policy design, carrier performance, dividend scale, and economic conditions. Life insurance products contain fees, charges, and internal costs that reduce cash value accumulation. Policy loans and withdrawals reduce the death benefit and cash value and may affect the policy’s ability to remain in force. Loans may become taxable if the policy lapses with outstanding loan balances. Dividends are not guaranteed. Consult qualified financial, tax, and insurance professionals before implementing any strategy discussed in this article.